
Amazon Listing Conversion Rate Flat While Traffic Holds? Find the Field
August 5, 2026 · 8 min read · by Aashirvad Kumar
Your credits refresh every month for as long as ListingRVA AI exists. No renewals, no annual increases, nothing to cancel.
Available on select plans. No renewals, ever.
August 5, 2026 · 8 min read · by Aashirvad Kumar
Sessions are where they always were. Impressions are healthy, the ad spend is producing clicks, and if you only looked at the traffic graph you would think the listing was doing well. Units ordered say otherwise. An Amazon listing conversion rate that falls while traffic holds steady is a specific and diagnosable problem, and it is not the one most sellers go looking for, because the instinct is to rewrite the bullets and the bullets are almost never the cause.
The useful thing about this failure is that it isolates itself. Traffic held, so discovery, indexing and relevance are all working well enough to put you in front of shoppers. Something between arriving and buying is failing, and there are only about eight candidates. Working through them in order of how much they move the number, and how cheap they are to check, gets you to the answer in an afternoon instead of a quarter.
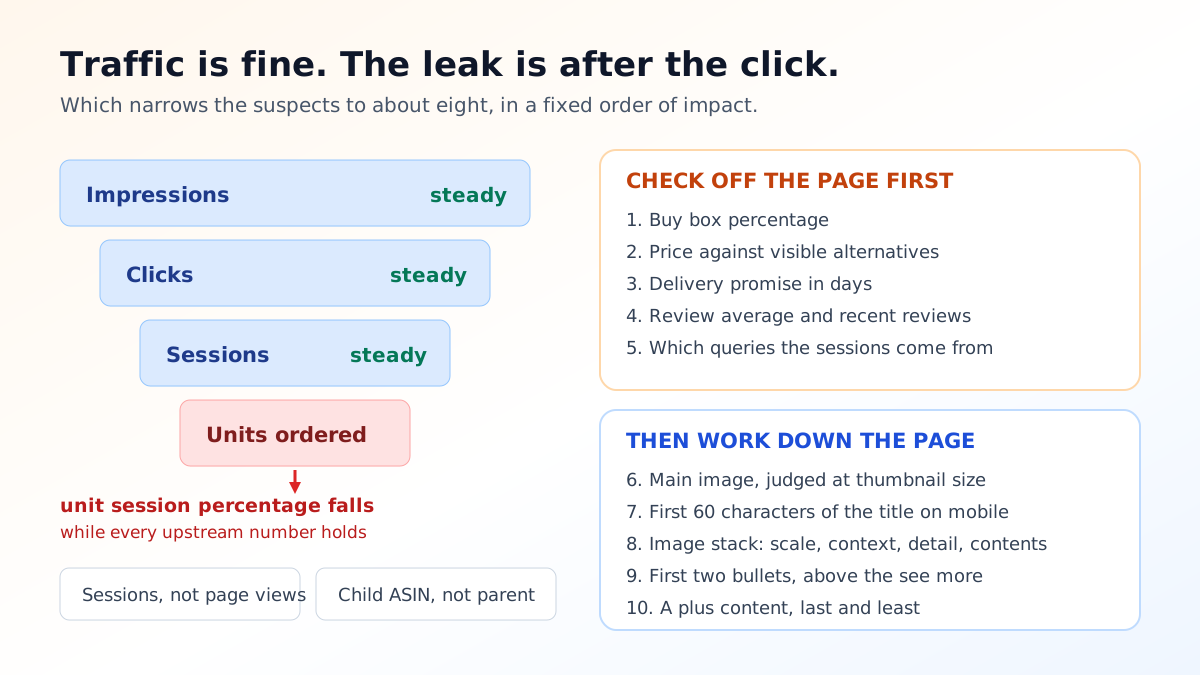
Open Business Reports and go to detail page sales and traffic by child item. The column that matters is unit session percentage: units ordered divided by sessions. Read it at child level, never at parent, because a parent figure averages a variation that sells briskly with one that does not and produces a number describing neither. A single dead colourway can drag a whole parent down while every real problem sits in one child. When a weak child turns out to be the listing and not the product, a full amazon listing optimization software pass rewrites the title, bullets and images that drive that session percentage.
Understand what a session is before you interpret it. A session is a visit inside a twenty four hour window, while a page view is a single load, so one shopper comparing three times in an evening produces several page views within one session. Conversion measured against page views therefore looks much worse than it is. Unit session percentage already uses sessions, which is why it is the figure to quote and to track.
Then set a benchmark you can actually use. There is no meaningful cross category average, because the number varies enormously with price point, category and how branded the traffic is. Your ASIN against its own previous ninety days is a real benchmark. Your ASIN against your other ASINs in the same category is a real benchmark. A figure quoted from somewhere on the internet is not, and chasing it will send you rewriting a listing that was fine.
Most of what determines an Amazon listing conversion rate lives outside the fields you can edit, which is why so many diagnoses start in the wrong place. Buy box percentage comes first: if you have lost the box, the add to basket button is pointing at somebody else and no amount of copy will recover it. Then price against the visible alternatives on the same search results page, then the delivery promise, which moves conversion sharply when it slips from two days to seven. A quick pass through an Amazon listing quality checker tells you which of your own fields are genuinely incomplete before you start attributing the drop to anything external.
Reviews are the fourth external factor and the most abrupt. A rating that crosses down through four stars, or a recent run of one star reviews sitting at the top of the review module, changes the decision for a large share of shoppers instantly and permanently until the average recovers. Read the recent negative reviews rather than counting them, because a specific repeated complaint about sizing or a missing part is also telling you which listing field created the wrong expectation.
The fifth is traffic quality, and it is the one that hides behind a healthy traffic graph. If you have started ranking for a broad query that describes a slightly different product, you will collect sessions from shoppers who were never candidates, and the rate falls even though the page is unchanged. The search query performance data in Brand Analytics shows impressions, clicks and purchases per query, so you can see directly whether the extra sessions are arriving from a term that never converts.
If the external factors are clean, start at the top of the detail page and work down, because the elements are not equally weighted. The main image does more than any other single asset, and not only on the detail page: it is the thumbnail that had to win the click in the first place, so a main image that is dark, cluttered, cropped too tight or ambiguous about what is in the box costs you at both steps. Everything the main slot is allowed and not allowed to contain is set out in the main image compliance rules.
The title is next, and the test is mobile. Titles truncate hard on a phone, so the question is not whether your title is complete but whether the first sixty characters or so identify the product, the key attribute and the size or quantity. If the visible portion reads as brand name plus keyword soup, shoppers scrolling a results page have no reason to stop. Writing to that constraint deliberately is what a good Amazon listing title generator is actually for.
Then the image stack. Shoppers swipe before they read, so images two through five carry more of the decision than any text on the page. The pattern that consistently works is scale, then use in context, then the specific detail that answers the most common objection, then what is in the box. If a repeated question in the customer questions section is answered nowhere in your images, that is a free instruction telling you what image six should be.
Bullets come after all of that, and on mobile the first two are usually the only ones visible before a see more control. Front load the two facts a hesitant buyer needs, and treat the remaining bullets as depth for the minority who expand them. A long bullet that opens with a benefit adjective is wasting the only line most people will read.
A+ content sits below the fold and does a different job: it reduces returns and answers second order questions rather than winning the initial decision. It is worth having and it is not where a conversion problem usually is, which is exactly why replacing perfectly good A+ modules is such a common way to spend a fortnight without moving the number.
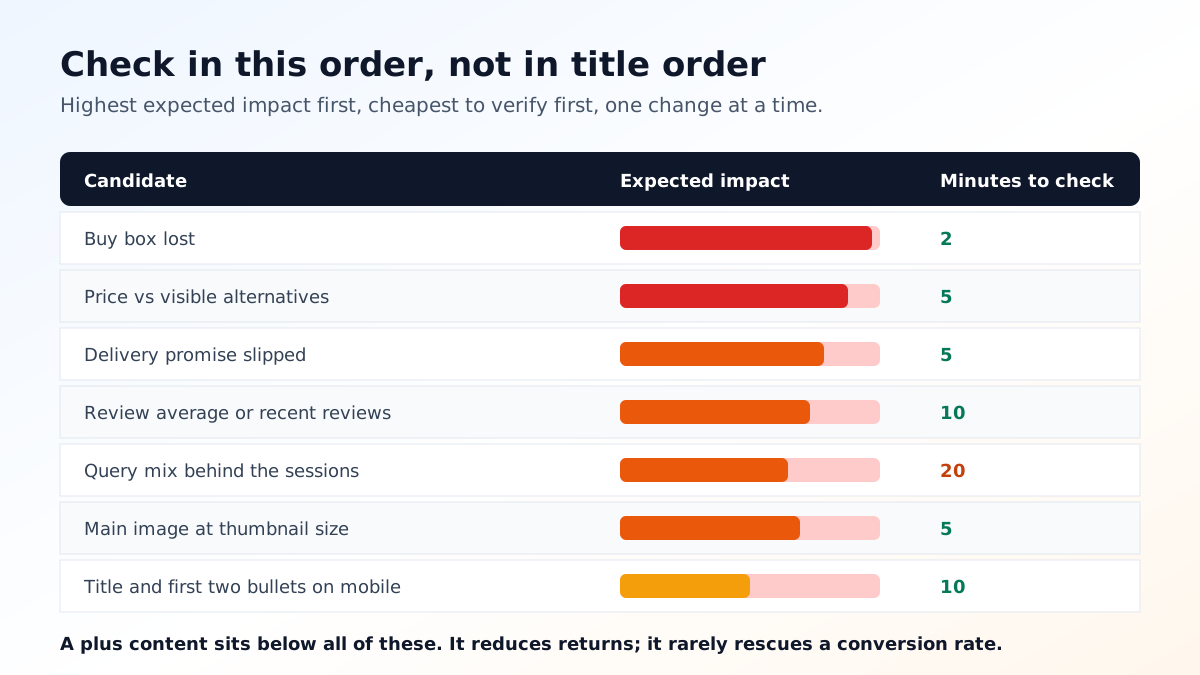
Amazon gives you no proper split testing on most listings, which means your only instrument is a before and after comparison against your own history. That instrument is destroyed the moment you change six things at once. Pick the single highest ranked candidate from your diagnosis, change only that, and leave it long enough to gather a comparable number of sessions, which on a low volume ASIN can be two or three weeks rather than two or three days.
Keep a dated log of every change with the unit session percentage before it. This sounds like bureaucracy and it is the difference between knowing that new main images lift your conversion by a measurable amount and merely believing they do. After half a dozen entries you have something better than any published benchmark: a record of what moves the number on your own catalogue, in your own category.
Watch the seasonal trap while you do it. If sessions rise because a category enters its peak, the extra traffic is broader and less committed, so a falling Amazon listing conversion rate during a rising traffic period can be entirely normal. Compare like periods, or compare against the category trend, before treating a seasonal dilution as a listing defect.
When the diagnosis lands on the image stack, which it often does, the constraint is usually production rather than knowledge. Sellers know they need a scale shot, an in context shot and a detail shot, and they do not have them because the original shoot did not include them and reshooting one product is disproportionately expensive. That gap is precisely what AI product photography closes, because generating the missing three from an existing clean product photo takes minutes rather than a booking.
The same logic applies to text once the images are right. A listing that has been diagnosed properly needs a specific rewrite of a specific field, not a wholesale regeneration, and rewriting for the query that actually converts is a different job from writing to be discovered at all. That distinction is the whole subject of the guide to listing copy that ranks, and it is worth reading before you touch a field that is already working.
Business Reports, then Detail Page Sales and Traffic by Child Item. The column you want is unit session percentage, which is units ordered divided by sessions. Read it per child ASIN rather than at parent level, because a parent figure averages a strong variation and a weak one into a number that describes neither.
There is no single number worth chasing, because it varies enormously by category, price point and whether the traffic is branded. The only benchmark that tells you anything is your own ASIN measured against itself over the previous ninety days, and your ASIN measured against your other ASINs in the same category. A cross category average is noise.
Because most of what determines conversion is not on your listing. Losing the buy box, a competitor cutting price, a delivery promise slipping from two days to seven, a review average falling below four stars, or ranking for a new and less relevant query will all move the number while your copy sits untouched. Check those before editing anything.
No, and confusing them makes the rate look wrong. A session is a visit within a twenty four hour window and a page view is a single load, so one shopper who returns three times to compare produces several page views inside one session. Conversion should always be calculated against sessions, which is what unit session percentage already does.
Frequently. If you rank for a broad query that describes a different product, you collect sessions from shoppers who were never going to buy, and the rate falls while the traffic graph looks healthy. Check impressions, clicks and purchases per query in the search query performance report before assuming the detail page is at fault.
The main image, because it is the only element that has to work at thumbnail size in search results before anyone even reaches the page. After that it is price against the visible alternatives, then the delivery promise, then the first two bullets. Copy further down the page moves the number far less than most sellers expect.
ListingRVA AI now works inside Claude. Connect your workspace and ask Claude to generate listing copy and publish product images to your store, without leaving your editor. See the Claude connector →
Comments
No comments yet, be the first.
Leave a comment